Statistical Count
Overview
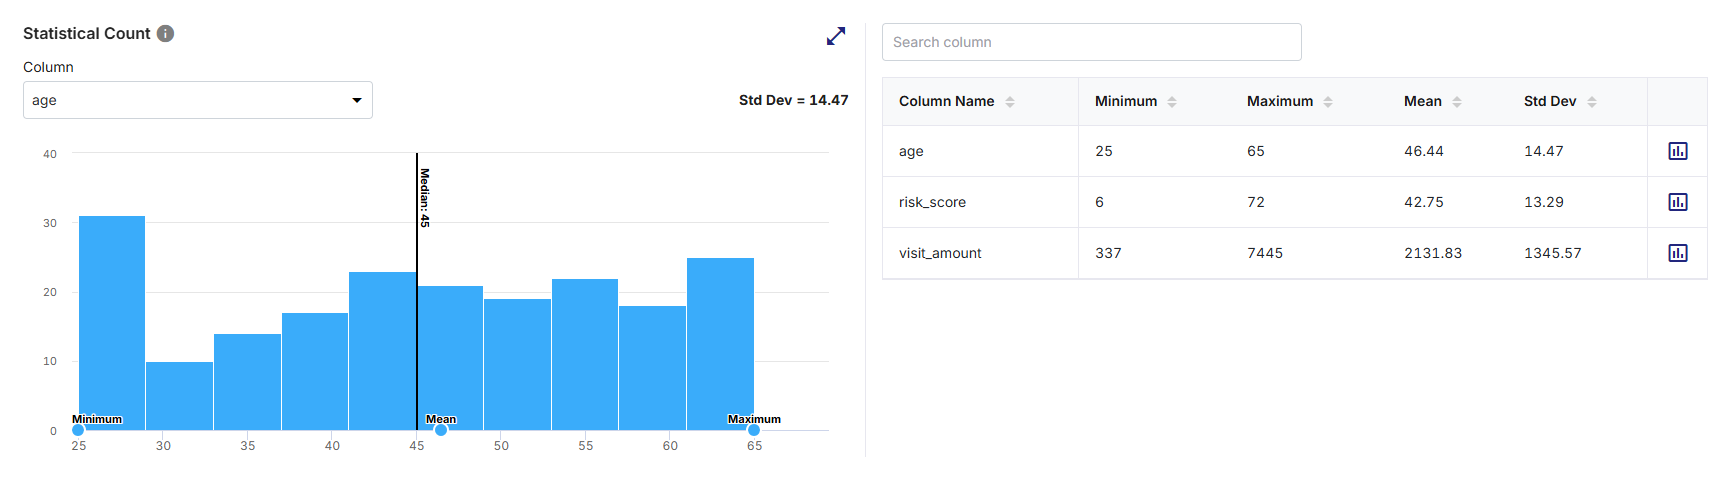
The Statistical Count widget provides a statistical summary of numeric columns in the dataset. It helps users analyze data distribution, central tendency, and variability by combining a histogram visualization with key statistical metrics such as minimum, maximum, mean, median, and standard deviation. This widget is particularly useful for identifying data spread, skewness, and outliers in numerical fields.
This widget supports data profiling and data quality validation to highlight how numeric values are spread and where they concentrate. It combines visual distribution analysis with precise statistical metrics, enabling users to quickly understand numeric data behavior and identify anomalies that may impact data quality or downstream analytics.
What the Widget Analyzes
-
Profiling dimension: Statistical distribution and descriptive statistics of numeric data
-
Level of analysis: Column-level analysis for numeric columns in the dataset
-
Calculation basis:
-
Statistics are calculated using the values present in each numeric column, considering non-null records only.
-
The widget computes minimum, maximum, mean (average), median, and standard deviation based on the observed data values.
-
What the Widget Shows
-
A histogram-based visualization showing the distribution of values for the selected numeric column.
-
Bars represent the frequency of values grouped into ranges (bins).
-
Key statistical indicators including Minimum, Maximum, Mean, Median, and Standard Deviation (Std Dev) displayed in context with the distribution. The Standard Deviation value is displayed above the chart.
-
A tabular summary listing exact statistical metrics (minimum, maximum, mean, standard deviation) for all numeric columns in the dataset.
-
The ability to switch focus between numeric columns for detailed analysis. Column-level selectors and indicators update the distribution and statistics shown for the selected column.
How to Read This Widget
-
Each bar in the histogram represents a range of numeric values within the selected column.
-
The height of each bar indicates the number of records whose values fall within that range.
-
Vertical markers on the chart represent key statistical measures such as:
-
Minimum - Lowest observed value
-
Maximum - Highest observed value
-
Mean - Average value
-
Median - Central value
-
-
The standard deviation value provides an indication of how widely the values are distributed around the mean.
-
The table compares statistical behavior across all the numeric columns.
Column Selection
-
The currently selected column name is displayed below the Column dropdown at the top left corner of the widget.
-
Selecting a different column from the dropdown list updates the histogram chart and distribution details dynamically.
-
Only one column can be analyzed at a time in this widget.
Available Views
The widget supports a histogram-based chart view that provides a statistical overview of value distribution for a selected numeric column. This view is intended for distribution analysis and not for drilling into individual records. It displays distribution of values for a selected numeric column and provides an immediate visual understanding of how values are spread across the range.
On the top-right corner of the visualization pane, use the:
-
Expand icon to visualize a larger view of the histogram for improved readability
-
Collapse icon to restore the widget to its default size
Note:
-
Hovering over a histogram bar displays a tooltip showing the value range and corresponding record count.
-
Hovering near markers helps identify minimum, mean, median, and maximum points.
-
Vertical statistical indicators (minimum, mean, median, and maximum) remain visible and they are updated based on the selected column.
-
Selecting a different column using the Column dropdown refreshes the histogram and associated statistics including the standard deviation value.
-
All interactions are read-only and do not alter the dataset.
Supporting Panes
The widget includes a Statistical Count tabular summary pane on the right, always visible alongside the visualization pane on the left, providing numeric metrics for all columns at once. It displays:
-
Column Name - Name of the dataset column
-
Minimum - Lowest value observed in the column
-
Maximum - Highest value observed in the column
-
Mean - Average value of the column
-
Standard Deviation - Measure of value dispersion within the column
Note:
The histogram provides a visual view of value distribution for the selected column, while the table provides exact statistical metrics for all numeric columns. Together, they enable both high-level distribution analysis and precise statistical comparison.
Pane Interactions
-
Providing a column name in the Search column list box filters columns in the table and quickly locates a specific column by name.
-
Clicking on the column headers sort columns in ascending or descending order based on the selected statistical metric.
-
Clicking the chart icon for each column opens the data distribution (Statistical value for current vs. last 5 runs) view for that specific column. This enables additional column-level exploration and quick comparison of ranges and variability.
-
Scrolling allows access to additional columns or statistical metrics when the list exceeds the visible space.
How to Interpret the Results
-
Tightly clustered bars indicate low variability.
-
Widely spread bars indicate high variability.
-
A mean far from the median may indicate skewed data.
-
A large standard deviation suggests inconsistent or widely varying values.
-
Minimum or maximum values far from the rest of the distribution may indicate outliers.
These insights help determine whether numeric data aligns with expected ranges and business rules.
When to Use This Widget
-
To understand the distribution of numeric data.
-
To identify outliers or extreme values.
-
To compare variability across numeric columns.
-
To validate assumptions about expected ranges and averages.
-
To support data quality checks related to range validation, numeric consistency, and statistical anomalies.
| What's next? Validity |